Big Data Analytics In Smart Cities: You Can’t Have One Without The Other
22nd February, 2018
Who else loves to see data science applied in the real world? I know I sure do… And seeing that was one of the coolest things I got to experience at World Cities Expo Istanbul (a smart cities conference). What I’m referring to here is big data analytics in smart cities.
What better way to apply data science than through Smart City technologies that improve and protect the quality of life in urban areas.
Introducing the Science of Cities
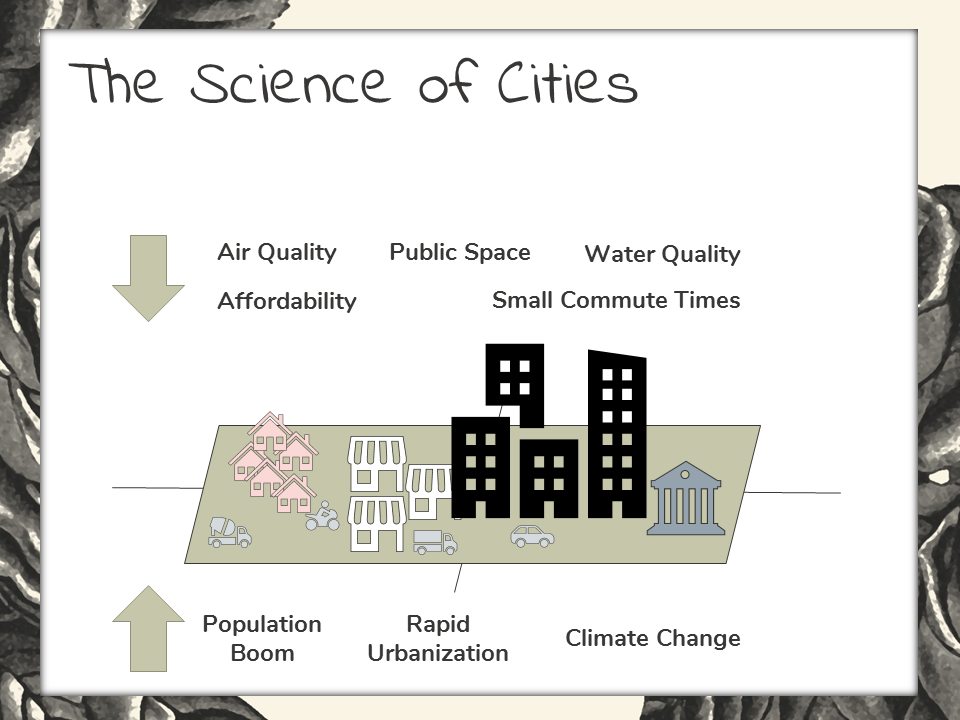
I want to start today by going all the way back to something that you’re probably all well familiar with – “The Science of Cities”
Just in case, “science of cities” is a quantitative approach that’s used to describe and model the networks and flows that make up an urban city.
Through a “science of cities” approach, organization’s like UN-Habitat are working hard to preempt urban cataclysms that population booms are likely to cause in the 21st century. So let’s look closer at UN-Habitat’s work. They’re deploying forecasting models to anticipate the spatial pattern and intensity of future urban sprawl in the world’s major cities.
The goal here is to anticipate how urban sprawl will negatively impact quality of life in these major cities.
Evaluating quality of life is just like any other type of analytics deployment – optimal metric selection is vital. They’re measuring things like:
- Area of public recreation space within a city
- Air quality – in terms of particulate matter
- Important water quality metrics, like fecal coliform counts and cryptosporidium
- Commute times – A metric that impacts both quality of life and air quality, and
- Average cost of living.
They use these metrics to benchmark the effects that population boom, rapid urbanization, and climate change are having on the quality of life in urban areas.
Looking Into the Quantified City Model
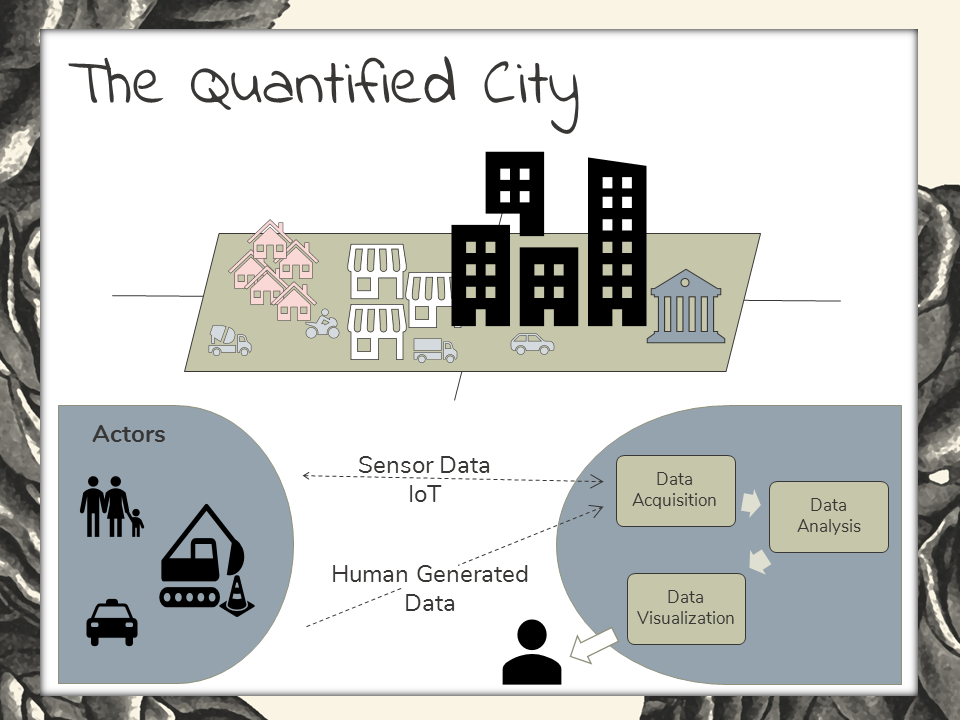
Now let’s look at “The Quantified City” approach. This is another data-driven construct that’s become popular as a way to understand crucial dynamics within cities. In the face of rapid urban population growth and aging infrastructure, experts are turning to this form of social computer science in hopes for a solution. It’s one form of big data analytics in smart cities solution.
“The Quantified City” model describes people, infrastructure, and services as actors in an urban system. These are the data generators. What types of data do these actors generate? Well, in the proposed model, actors are generating sensor data and human-generated data, like that last post you published on your Facebook page.
The third element of this model is the data platform, where the data is ingested, analyzed, and visualized.
It is made ready for consumption by the end user, probably an urban planning expert of some kind.
Now let’s talk about “Big data”. You’ve heard of it, I know. Probably you’ve heard too much about it and wonder, when is this fad going to end. Well as a data scientist myself, I am here to say – never! Big data is not a fad. Although the world has gone buzzword crazy, big data is here to stay. In fact, I offer that – big data is the new normal. The hype will fade, and when it does we’ll still be emerged in a big data world.
What is big data? I really like Intel’s definition of big data. That is:
A big data project is a project that can NOT be carried to completion without the implementation of at least one big data technology (like Hadoop, Spark, NoSQL, or any of the others).
Let’s bring big data back to a more real-world level though. Big data is the thousands of data points that you generate each day when you cross town using your cell phone to send emails and texts, to check your Facebook or to schedule a meeting in your calendar.
Taken in-mass, the digital exhaust we’re all generating every day is one form of what’s come to be known as “big data”.
People that work to generate value from big data are “data professionals”. There are 3 main classes of data professional. Those are data engineers, data scientists, and analytics specialists.
Let’s look now again at “The Quantified City”.
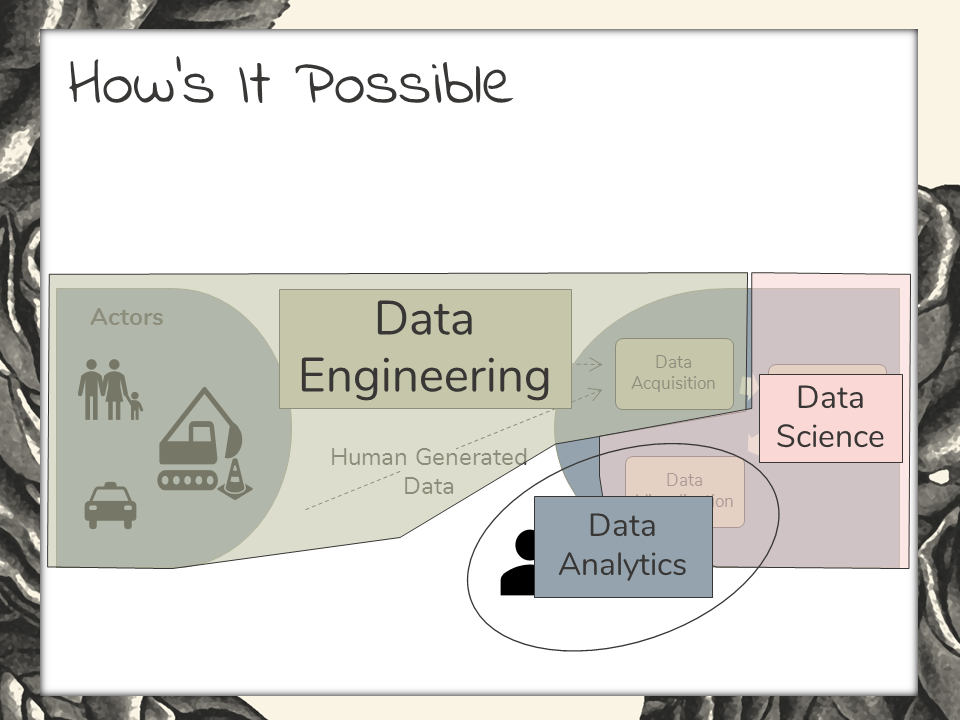
Data is generated by our actors, on the left. This data is ingested by, or “acquired” by data engineered systems. These systems ingest, store, bulk process, and maintain the data. That’s data engineering.
Data scientists then come in and work with the data. They clean it up, reformat it, and build predictive models from the data. Data science is the layer where the predictions are made and visualized for end-users. This is where big data analytics in smart cities are translated to valuable predictive insights.
End users can be data analytics specialists. In these cases, the analytics professionals would be using point-and-click applications to work with data and make their own form of high-level visualizations. In other situations, the end user may be a city planner or municipal engineer. Data analytics serves a decision-support role. These are the high-level takeaways from big data.
To give you a different angle on the data professions that support the “Quantified City” model, I want to name-drop a few of the technologies associated with each of these roles.
“Big Data” technologies are synonymous with data engineered technologies. The most common of those are Hadoop, Apache Spark, NoSQL, and Massively Parallel Processing.
Data scientists commonly use Python, R programming language, and Spark to build and deploy machine learning and deep learning models.
Analytics specialists use applications to help in a decision-support capacity. Popular applications go by the name of Spotfire, Tableau, and SAP Dashboard Design.
A Big Data Analytics Use Case in Transportation
Let’s look at some use cases for big data in city infrastructure now.
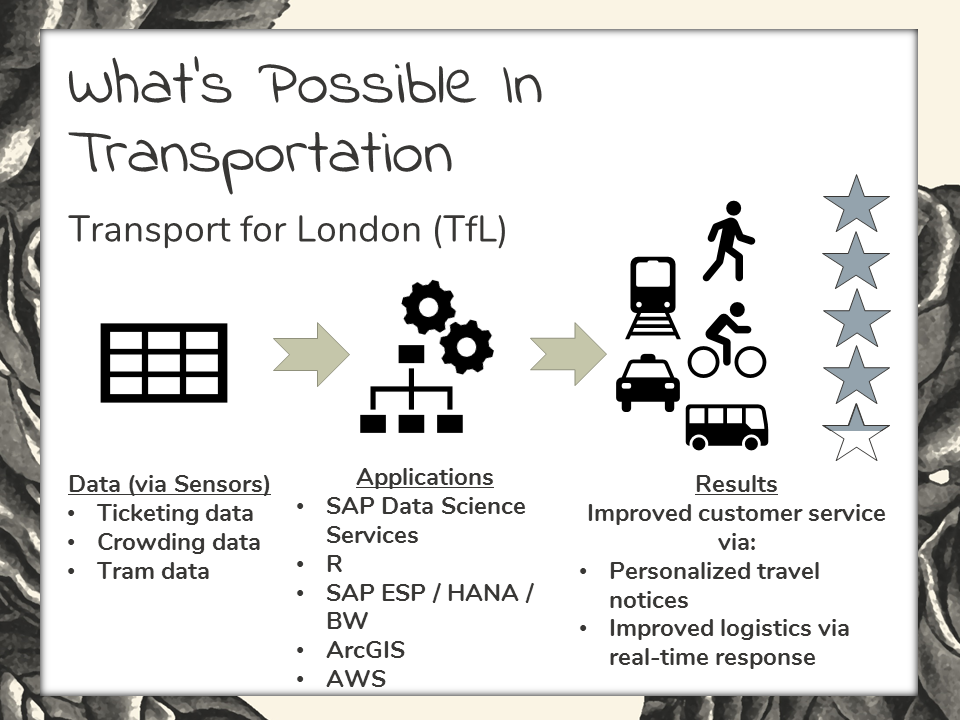
Transport for London (or TfL) is the public transport provider that’s responsible for managing logistics involved in the transportation networks that serve London’s 8.6 million residents. Most notably, they’re responsible for the scheduling, operations, and maintenance of “the Tube”. With respect to big data analytics in smart cities, TfL is most concerned with growth in London, and how to most effectively meet the projected infrastructure demands in due time. As a by-product of their progressive data-driven approach, current users are enjoying a higher level of customer satisfaction.
To talk of specifics, their project is built on 150 terabytes of data, most surely stored in a Hadoop HDFS cluster.
This data is coming from machines and from the humans that are served by them. TfL uses mostly SAP products to process and make sense of their data.
Favorable results include improved transportation logistics via real-time response. And even personalized travel notices that are sent to subscribed customers as a courtesy.
A Big Data Analytics Use Case in Education
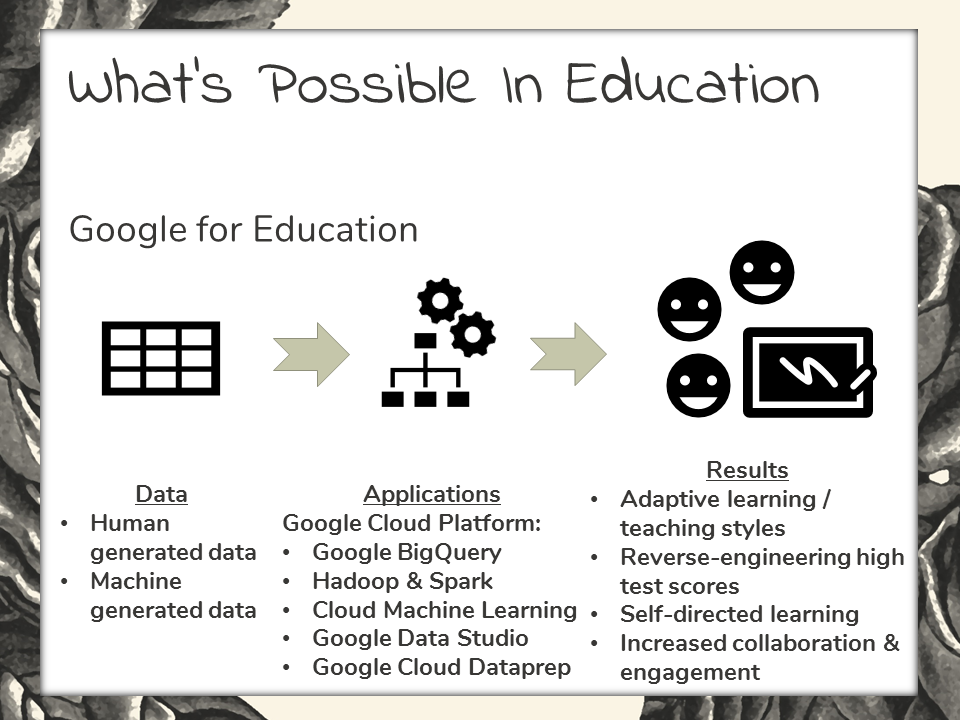
Let’s also take a quick look at big data in educational services here. Google for Education is a cloud based application that is developed through the Google Cloud Platform as a way to deliver education services. It’s been used in the elementary through high school level education.
On the back end, Google for Education runs on the big data infrastructure that’s available through the Google Cloud Platform. More specifically, Hadoop, Spark, Machine Learning and others.
As far as results, by deploying this data-driven approach, education providers have been able to reverse engineer their student’s way into higher standardized test scores. Student’s also enjoy adaptive learning strategies, self-directed learning, and collaborative methods within their educational experience.
About the Author
Lillian Pearson
Lillian Pearson is the facilitator for PLUS Specialty Training’s Certificate in Big Data and Data Analytics and Certificate in Data Science. Lillian is a leading expert in the field of Big Data and Data Science who equips working professionals and students with the data skills they need to stay competitive in today's data driven economy.
She is the author of three highly referenced technical books by Wiley & Sons Publishers: Data Science for Dummies (2015), Big Data / Hadoop for Dummies (Dell Special Edition, 2015), and Big Data Automation for Dummies (BMC Special Edition, 2016).
Lillian has spent the last decade training and consulting for large technical organizations in the private sector, such as IBM, Dell, and Intel, as well as government organizations, from the U.S. Navy down to the local government level.
As the Founder of Data-Mania LLC, Lillian offers online and face-to-face training courses as well as workshops, and other educational materials in the area of big data, data science, and data analytics.
Related Blogs

AI - Our Individual Mobile Library
The AI Revolution: Unleashing Your “Personal Mobile Library” for Enhanced Productivity In today's fast-paced, information-driven world, artificial intelligence (AI) has emerged as an indispensable tool fo...
Bassam M. Nammour, DBA
10th April, 2023
Read More

AI Will Change The Way We Work Forever
AI-powered content creation is a rapidly growing field that has the potential to revolutionize the way we create and consume content. With the help of natural language processing (NLP) and machine learning (ML) alg...
Louise Whaites
18th January, 2023
Read More

Three Tips to Boost the Success of Your Artificial Intelligence Project
Artificial Intelligence projects at government agencies regularly hit the headlines. But the business world is facing these challenges as well. At the end of 2016 Gartner estimated that 60 percent of big data projects ...
Facilitator/ Blogger
4th March, 2019
Read More

The Future of Artificial Intelligence depends on trust
Artificial intelligence (AI) is wildly popular, and it seems as if it is omnipresent applied. It is the foundation for your social media timeline, and with almost every interaction online follows an AI implementation p...
Facilitator/ Blogger
9th September, 2018
Read More